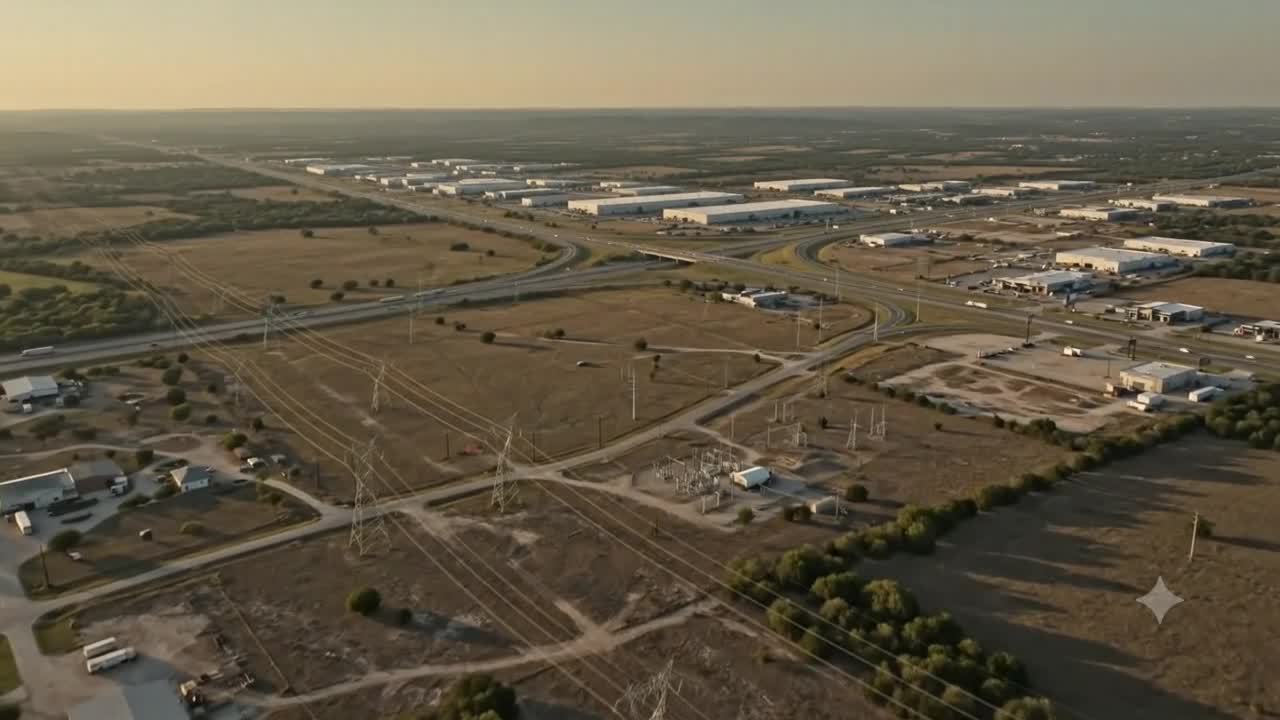
248 data center projects announced in Texas. Most will never break ground.
Caliche Intelligence tracks the filings that can't be faked — interconnection deposits, air permits, land closings, utility agreements — and tells you which Central Texas projects are real, which are stalled, and which are press releases. Verified weekly by people, with every source linked.
Personalize this page:
7 counties · 12 public databases · verified weekly · updated 2026-06-29
01 · The problem
The signal-to-noise ratio has collapsed.
248+
announced Texas data-center projects — roughly 20 in the Austin area alone.
Texas Tribune analysis, 2026
~439 GW
of grid connection requests in the queue — about 5× the grid's all-time record peak demand.
ERCOT interconnection reporting, 2026
“No good way”
is the industry's own admission for vetting which requests are speculative and which are real load.
ERCOT testimony, April 2026
02 · Announcement vs. record
The announcement and the record are two different documents.
Left: what the press release said. Right: what the public record shows. This is the check we run weekly on every announced project in seven counties.
What the press release said
“Sagebrush Digital announces a $1.1B, 300 MW liquid-cooled colocation campus in Hutto — first capacity targeted for 2027.”
— Sagebrush Digital Infrastructure · illustrative example
What the public record shows
- ERCOT queueInterconnection advanced to facility study · 2026-03-05
- County deed30-acre site closed, warranty deed recorded · 2025-06-17
- Utility agreementWater & wastewater service approved by council · 2025-10-08
- City permitsVertical construction permits issued for Building 1 · 2026-06-10
Status: CONFIRMED
Every claim left a paper trail. Money down, land closed, steel above grade.
03 · Coverage
Seven counties. Completely.
Travis, Williamson, Milam, Hays, Caldwell, Bastrop, and Bell — every announced data-center project, scored on public evidence and re-verified weekly. Depth beats breadth when the question is where to spend your quarter. Explore the sample board as of 2026-06-29.
Tap a county to toggle it, or to open previews.
7
counties selected
18
projects monitored
5
showing money-down evidence
5
gone quiet or contested
5,290 MW announced across the selection* *announced by developers — not a Caliche verification
Illustrative examples showing how tracking works — the live board covers the same seven counties with verified, source-linked records.
04 · How we verify
Reality leaves a paper trail
Four signal classes, each drawn from records that cost real money or real commitment to create. Software watches the databases; people verify every entry.
Signal 01
Money down
Interconnection deposits at $50k/MW. Nobody parks seven figures with the grid operator for a press release.
Checked weekly against PUCT dockets and ERCOT reports
Signal 02
Permits
TCEQ air and water filings. Backup generation needs an air permit; a campus needs water. Applications carry dates and addresses.
Checked weekly against TCEQ databases
Signal 03
Dirt
Deeds, plats, and county records. Land either closed or it didn't — the county clerk doesn't do hype.
Checked monthly across 7 county records systems
Signal 04
Politics
Council agendas, abatements, moratoriums, organized opposition. The public record shows friction before the press does.
Agendas reviewed weekly, hearings attended in person
05 · The scorecard, annotated
What a subscriber record actually contains
Every tracked project gets a scorecard like this. Click an element to see what it tells you — then compare a campus that's advancing with one that went quiet.
Sagebrush Digital Park
SampleWilliamson County · Hutto · Sagebrush Digital Infrastructure
2 Status timeline
- 2025-01-22ANNOUNCED
- 2025-06-17ADVANCING
- 2026-06-22CONFIRMED
3 Evidence ledger · 5 entries
- 2026-06-10 PERMIT verifiedVertical construction permits issued for Building 1 by the City of Hutto.source: City of Hutto permit records
- 2026-03-05 ERCOT estimatedInterconnection request advanced to facility study per queue publication (est. mapping from queue entry name).source: ERCOT large-load queue report ↗
- 2025-10-08 GOVERNMENT verifiedWater and wastewater service agreement approved by Hutto City Council; agenda item and minutes published.source: Hutto council agenda ↗
Source links point to real public databases — the project shown is illustrative.
4 Confidence rubric
5 Location
Hutto, Williamson County · city-level · geocoded · Maps link for subscribers
What a subscriber record contains
06 · What you get
The report on Monday. The board around the clock.
Every Monday morning
The Caliche Report
What changed, what filed, and what went quiet across Central Texas — every item tied to a project, a signal class, and a source. Read it in five minutes before your Monday pipeline call.
From the current sample · Week of 2026-06-29
2026-06-25 ERCOT · Project Cottonwood · Milam County
The interconnection queue entry associated with the Cameron-area campus is shown as inactive in the June large-load report. This is the second consecutive report without activity; status remains STALLED, trend down.
2026-06-24 HIRING · Project Caldera · Milam County
Site operations and commissioning roles posted for the Rockdale campus. Hiring for operations staff is a late-stage reality signal; status remains CONFIRMED.
2026-06-27 GOVERNMENT · Blackland Grid Campus · Williamson County
No new filings since the county adopted noise and setback standards on May 28. The developer's stated redesign review is now a month old with nothing on file; watch for a revised site plan or a withdrawal.
24/7 · updated as filings land
The Board — full access
Around-the-clock access to the real-time board: every tracked Central Texas project unlocked, with its reality status, trend, and the complete evidence ledger behind each one — the latest deposits, permits, deeds, and agenda items as they're verified.
- · Every project's scorecard and full evidence ledger
- · Statuses re-verified weekly; dated to the filing
- · New evidence flagged for the counties you care about
- · Locked rows on the public demo? All open here.
07 · Pursuit math
What one dead pursuit costs — and what catching it early is worth
Your inputs, your assumptions, visible formulas. Pick your role above to start from a preset, then make the numbers yours.
Your numbers · editable
- opportunities researched / quarter
- Hours of research per one
- Loaded hourly cost ($)
- Cost of one fully-pursued dead opportunity ($)
Of the 18 sample-board projects, 5 are press-only and 5 have gone quiet or face opposition.
Assumption — verify against your own workflow.
Assumption — your leverage, your number.
14 hrs
research hours redirected per quarter= 8 × 3 × 60%
$158,400
dead-pursuit exposure avoided per year= 32 pursuits × 55% × $18,000 × 50%
One avoided dead pursuit pays for 45 years of Field.
Estimates for planning conversation only — based on your inputs, not measured Caliche results. We don't have public case studies yet; we'd rather show you the board.
08 · Who's behind this
A team of analysts, not a dashboard
Caliche Intelligence is a team based in Austin, with hands-on expertise across the areas that decide whether a project is real: grid interconnection and ERCOT process, utility and environmental permitting, land and title records, and municipal government. The team built the monitoring infrastructure that watches a dozen government databases, and attends the hearings in person.
Caliche is the hard ground Texas builds on. We track which projects are actually standing on it.
7
counties monitored, completely
4
record classes — money, permits, dirt, politics
Weekly
re-verified before every Monday brief
Every call we make is logged and dated. The public track record publishes as it accrues — no borrowed logos, no invented testimonials.
09 · Pricing
Public pricing. Three tiers. No sales maze.
Pick the tier that matches how far your work reaches and how your team uses the intelligence. Every plan starts with a 20-minute walkthrough.
Field
Sized to your reach
$3,540 / year · 1 seat
For the individual rep working a patch.
- Live board, scorecards & full evidence ledgers
- The Caliche Report every Monday
- Territory setup + the projects nearest you
- County alerts for up to 3 counties
- Pursuit-timing signal chips
Desk
Most chosen ★Unlocks the workflow
$8,340 / year · 5 seats (+$99 each)
For teams running pursuits together.
- Everything in Field, plus:
- All-county alerts with per-seat routing
- Location intelligence + map view
- CSV export + scorecard snapshots
- 12-month status-change history
- 2 watch requests / quarter · quarterly analyst briefing
Bedrock
Speed, data access & human time
$17,940 / year · 15 seats
For organizations that need depth, speed, and an analyst on call.
- Everything in Desk, plus:
- Same-day alerts on money-down moves
- API / data-feed access
- Full history + entity watches
- Unlimited watch requests (fair use)
- Monthly briefing + ask-an-analyst within 48h
Every plan starts with a 20-minute walkthrough — pricing is public, so there are no surprises. Field is sized to your reach; Desk unlocks the workflow — export, seats, timing detail, watches; Bedrock adds speed, data access, and analyst time. Keep the data from the walkthrough either way.
10 · Questions
The five things everyone asks
- Where does the data come from?
- Public records only: ERCOT interconnection reports, PUCT dockets, TCEQ permit databases, county deed and appraisal records, and municipal/county agendas — plus press coverage, always labeled as such. Every evidence entry names its source type; public sources get links.
- How often does it update?
- The board is reviewed and updated weekly, before the Monday brief goes out. Each project shows its own last-verified date, and the whole board carries a global as-of date.
- What does a reality status mean — and what doesn't it claim?
- Statuses summarize observed public evidence: CONFIRMED means money down plus land closed plus permits filed; ANNOUNCED means press coverage only. A status is never a claim about a developer's intentions — "no filings observed since March" means exactly that.
- What's the coverage area?
- Central Texas today: Travis, Williamson, Milam, Hays, Caldwell, Bastrop, and Bell counties. Statewide coverage expands as the subscriber network grows.
- How does access work?
- Request access, then a 20-minute call, then you're onboarded. No self-serve signup — the team requires a 20-minute call with every subscriber first, which is also how the coverage stays honest.
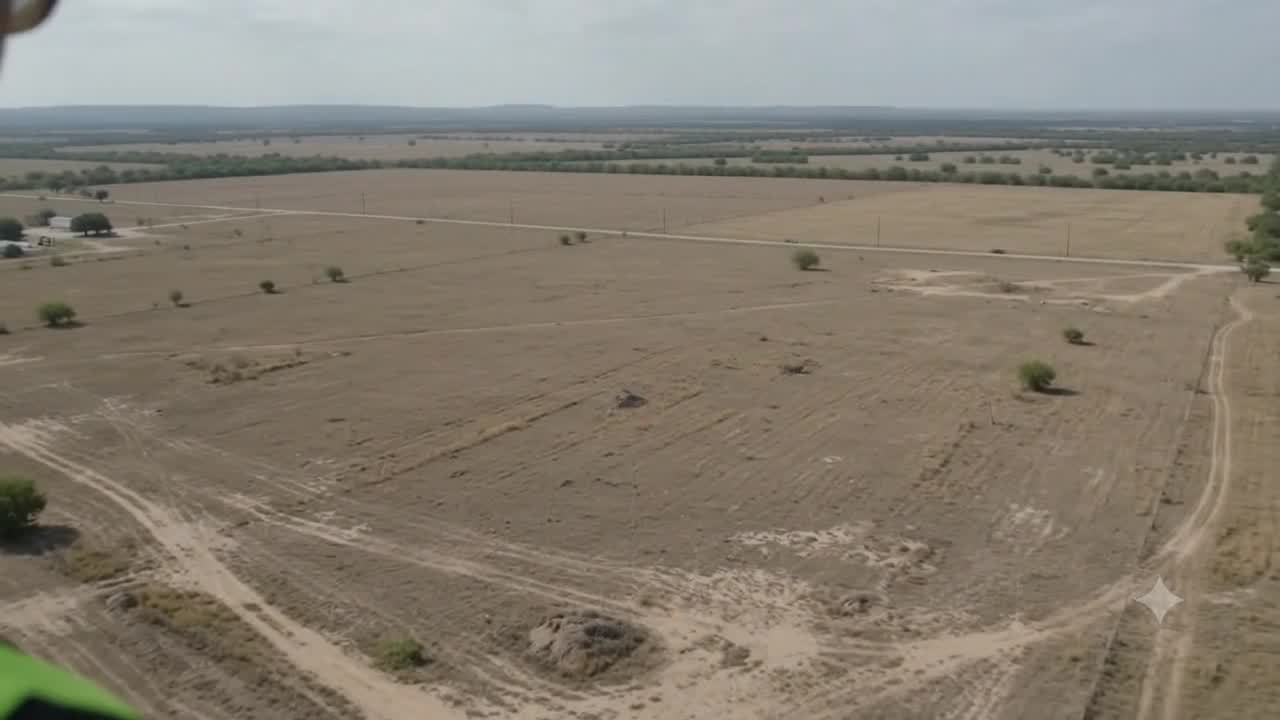
From the air, every announcement looks the same
20 minutes. Your counties, live. Keep the data either way.
We'll walk you through the live board and give you the verified status of the three projects nearest your territory — yours to keep whether or not you subscribe. Pricing is public. The team replies within one business day.